Results
Results is where the answers arrive. It appears once a campaign has been published, since until then there is nothing to count.
Results can be read for the whole campaign or for one distribution at a time, and the header says when the last response came in.
Sessions and responses
Two totals run through this page and they are not the same number.
A session is one attempt at the campaign, whatever became of it. A response is a session somebody finished. Every response is a session; most campaigns have sessions that are not responses.
Results keeps them apart deliberately and never mixes them, so a figure is always a share of one or the other. The headline reads as responses of sessions for exactly this reason.
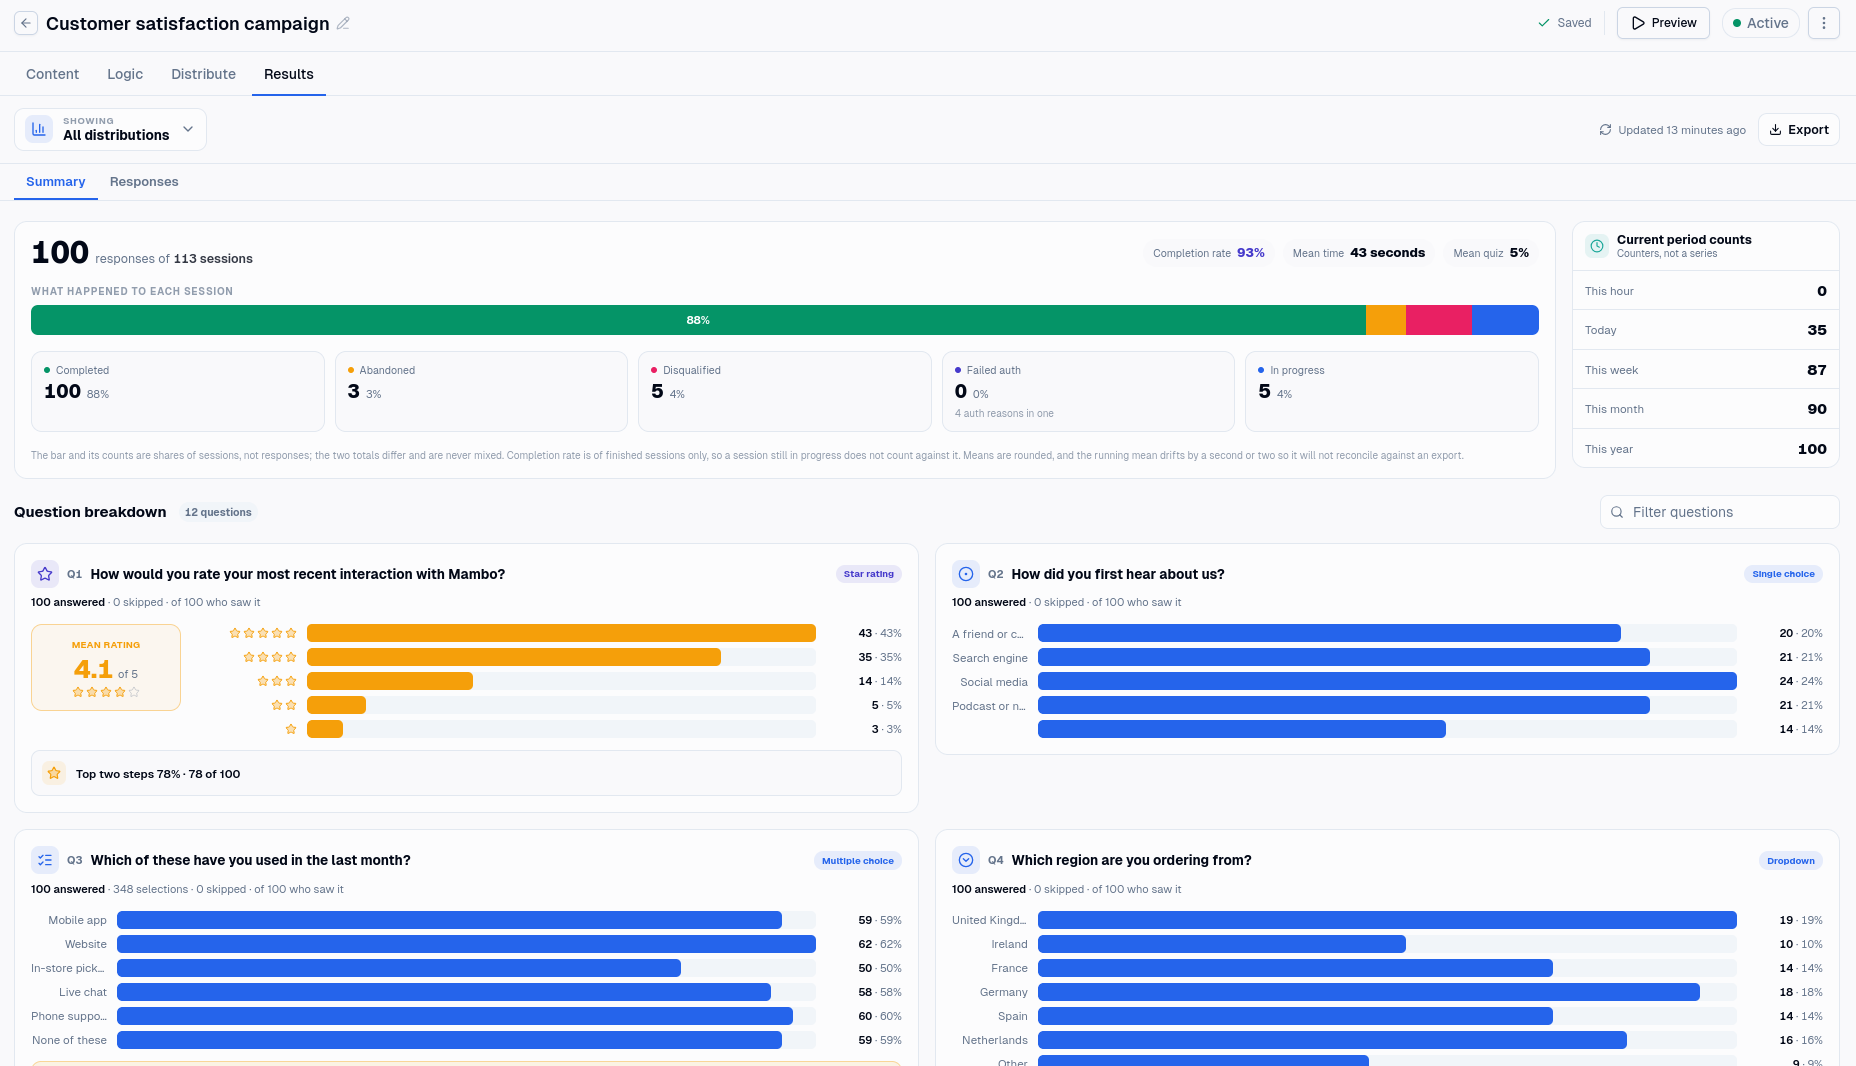
The summary figures
Completion rate is the share of finished sessions that completed. Sessions still in progress are left out of it entirely, which is the point: a session that is still going has not had its chance to finish, so counting it would make the rate fall whenever traffic arrived and climb as it drained.
Mean time and mean quiz score are running averages, rounded. They will not reconcile exactly against an export, and the mean time in particular drifts by a second or two. Treat them as a sense of scale rather than a figure to quote.
What happened to each session breaks the total down five ways:
| State | Meaning |
|---|---|
| Completed | Reached an ending. |
| Abandoned | Walked away part way through. |
| Disqualified | Ended early by a rule or a time limit. |
| Failed auth | Turned away over who the participant was. |
| In progress | Still going. |
Failed auth covers four different refusals, which Results does not separate: the participant already existed, did not exist, had already taken part, or their details could not be saved. See Identifying participants.
Current period counts
The period counters show how many responses have arrived in each period still running: this hour, today, this week, this month, this year.
They are counters rather than a history. "This week" is the current week only, and when it rolls over the figure starts again from zero. They exist to tell you where you stand against your response limits, not to chart a trend.
Question breakdown
Each question gets a card, showing how many people saw it, how many answered and how many skipped it.
How to read the card depends on the question, and the differences are real rather than cosmetic.
Choice questions show a share per option. Where participants could pick several, the percentages are of people rather than of picks, so they will add up to more than 100.
Rating questions show the distribution across the scale plus a mean, and how many chose the top two steps.
Net Promoter Score shows the histogram and the score, with detractors, passives and promoters marked. Occasionally the score is withheld: it needs the scale to run 0 to 10 with every step present and readable as a number, and if yours does not, the histogram is still drawn but no score is shown. A wrong score gets quoted, a missing one gets questioned.
Matrix questions show counts and no percentages. One participant answers several rows, so the responder count is inflated by roughly the number of rows and any percentage taken against it would be wrong by that factor.
Ranking questions show how often each item landed in each position, and a mean position. Lower is better. There is no most-picked item, because everybody ranks everything.
Text questions have no chart. Answers are stored as text with nothing to tally, so the card says so and points you to the individual responses.
A single tick box shows how many ticked it rather than a distribution, since one box with two states has no shape to draw. Everyone who left it unticked is counted among the skips.
Quiz questions carry their score alongside, with how often each was answered incorrectly. See Quizzes.
Individual responses
The Responses tab lists sessions one per row, with who, which distribution, what became of it, how long it took and what it scored.
Note that it lists sessions of every state, including ones still in progress, so it holds more rows than the response total beside it. The label is the shorter word, not a narrower filter.
Opening a row shows that participant's answers, question by question, along with the rewards their session earned. This is the only place in Mambo that shows an individual participant's answers and contact details together, which is worth remembering when deciding who has access to a campaign.
Answers voided by a later rule are marked as such rather than counted as answered. See Logic.
Exporting
Responses can be exported for the whole campaign, which gives you every session with its answers, its identification, its variables and its rewards.
Export before you destroy anything. Several actions delete results permanently and none of them can be undone afterwards.
What destroys results
- Deleting a distribution and publishing erases every response collected through it, and lowers the campaign totals to match.
- Deleting a question and publishing erases its answers. The campaign's response total is unaffected, but that question disappears from the breakdown and from exports.
- Removing options from a question erases their tallies while the question keeps its total, so the remaining percentages will no longer add up.
- Resetting the campaign erases everything: every session, every response, every tally. See Publishing.
The publish review warns you about the first three before they happen, and asks you to confirm when responses are at stake.